Free Sales Items Analysis Tool Online
Upload your sales CSV and get instant charts, insights, and actionable reports. Understand your top sellers, category performance, and sales trends in seconds. 100% free, no signup required.
Loading saved data...
How to Use This Free Sales
Items Analysis
Tool Online
No technical skills needed. Just export your sales data, upload it here, and get instant insights.
You Already Have This Report in Your System
Almost all ERP and billing software have a Sales Item Report or Sales Register built into them. Whether you use Tally, Busy, Marg, Zoho, or any other software, you already have this data. Simply export that report as a CSV file, upload it here, and let our tool do the analysis for you.
Export Your Sales Item Report as CSV
Go to your ERP or billing software and find the Sales Item Report (sometimes called Sales Register or Itemwise Sales Report). Export it as a CSV file. The file should contain columns like Date, Invoice Number, Customer Name, Product Name, Quantity, Rate, and Amount.
Upload and Map Your Columns
Drag and drop your CSV file into the upload area above. If your column names are different, the tool will ask you to map them. Just select which column contains the Date, Product, Amount, and so on. It takes less than a minute.
Get Instant Insights
Click "Process Data" and see your complete sales dashboard instantly. Get total revenue, top selling products, best customers, monthly and yearly sales trends, and much more. All processing happens in your browser, so your data stays private.
Sample Data Format
Your CSV file should look something like this. Column names may vary, and you can map them during upload.
| Date | Invoice | Customer | Product | Qty | Rate | Amount |
|---|---|---|---|---|---|---|
| 2024-01-15 | INV-001 | Rakesh Sharma | Jeans | 3 | ₹450 | ₹1,350 |
| 2024-01-16 | INV-002 | Priya Patel | Frock | 5 | ₹180 | ₹900 |
| 2024-01-17 | INV-003 | Amit Kumar | Shirt | 2 | ₹380 | ₹760 |
| 2024-01-18 | INV-004 | Sneha Reddy | Kurta | 4 | ₹200 | ₹800 |
This is just sample data. Your actual export may have different column names, which you can map during upload.
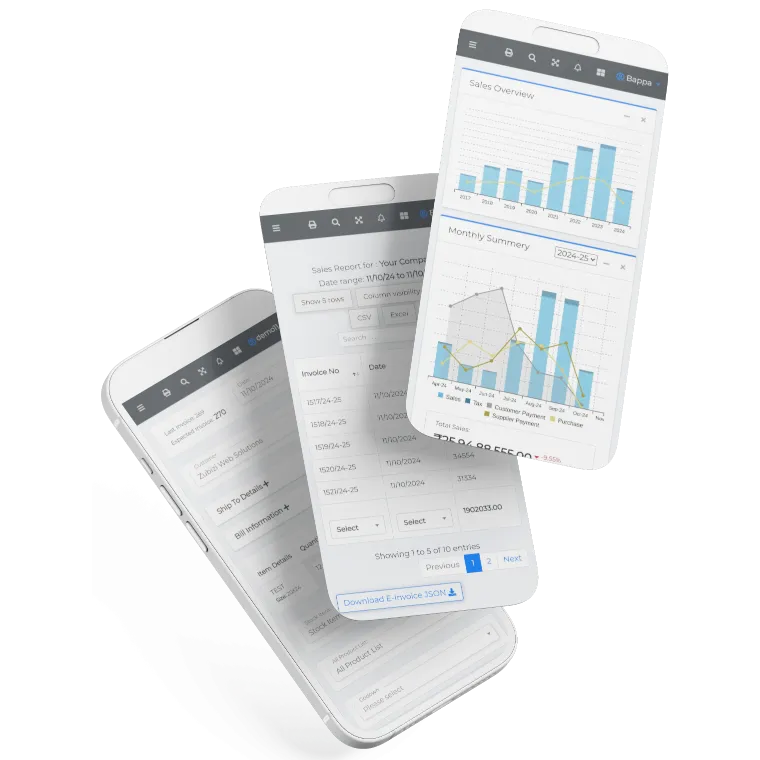
What You Get With This Free Sales Items Analysis Tool Online
Upload your CSV once and get a complete picture of your business performance. Here are the reports and insights waiting for you.
Summary Dashboard
Get a quick snapshot with four key numbers: Total Revenue, Current Year Sales, Total Customers, and Total Products. These update instantly based on your data.
Yearly Revenue Chart
See how your revenue has grown over the years. Data is grouped by financial year (April to March) for easy comparison.
Monthly Sales Trends
Track how your sales move month by month. Spot peak months, slow seasons, and plan your inventory better.
All Years Comparison
Compare monthly performance across different financial years on a single chart. Find patterns in your sales.
Top 10 Best-Selling Products
Find out which products bring in the most money. See product name, size variant, total revenue, and quantity sold. Use this to stock up on winners and make smarter buying decisions.
Top 10 Customers with Purchase Behavior
Know your most valuable customers and understand their buying habits. See total spending, number of purchases, first and last purchase dates, average gap between visits, and days since last purchase. Identify loyal customers and spot those who might be slipping away.
We are constantly improving this tool to add more useful reports and features.
Why Use This Free Sales Items Analysis Tool Online?
We built this tool to help retail businesses understand their performance and make smarter decisions. Here is what makes it different.
100% Free Forever
No hidden costs, no premium tiers, no usage limits. Our sales items analysis tool is completely free to use as many times as you want. We built this tool to help small and medium businesses make better decisions without expensive analytics software. Use it daily, weekly, or whenever you need insights from your sales data.
No Signup Required
No email registration, no account creation, no credit card details. Just visit the page and start analyzing your sales data immediately. We respect your time and understand that you want quick answers, not another username to remember. The tool is ready the moment you need it.
Complete Data Privacy
Your sales data never leaves your browser. All processing happens locally on your device using modern JavaScript. No server uploads, no cloud storage, no third-party access. Your competitive information remains completely confidential. Analyze sensitive financial data with total peace of mind.
Professional-Grade Insights
Get the same quality of analysis that enterprise businesses pay thousands for. Beautiful charts, smart recommendations, and actionable business intelligence. Our tool was designed by retail experts who understand what metrics matter for your business growth and profitability.
Built for Retail Businesses
Unlike generic data tools, our sales items analysis is purpose-built for retail. It understands product categories, sizes, variants, and seasonal patterns. Whether you run a fashion boutique, electronics store, grocery shop, or any other retail business, the insights are tailored to how your industry works.
Need More Than Basic Analysis?
This free sales items analysis tool online gives you a great starting point. But growing businesses need more. Zubizi ERP offers real-time analytics, automatic inventory tracking, GST-compliant billing, and much more. Everything works together in one system.
Get a personalized demo to see how Zubizi can help your retail business save time and make smarter decisions. Our team will show you features built specifically for Indian retailers.
Frequently Asked Questions
Common questions about our free sales items analysis tool.