Free Sales Analysis Dashboard - Visualize Your Sales Data Instantly
Upload your sales CSV or Excel file and get instant insights with interactive charts, customer analytics, and financial year summaries. No signup required. Your data stays private and never leaves your browser.
Loading saved data...
How to Use This Free Sales Analysis Dashboard
Turn your raw sales data into actionable insights in minutes. Follow these simple steps to analyze your sales performance, identify top customers, and track financial year trends.
Upload Your Data File
Drag and drop your CSV or Excel file containing sales data. The tool supports files with columns for date, customer name, amount, and invoice details.
Map Your Columns
Select which columns contain date, customer name, and total amount. The tool auto-detects common formats, but you can adjust mappings manually.
Process and Analyze
Click process and watch your data transform into interactive charts and tables. Get instant metrics like total sales, average order value, and customer counts.
Explore Insights
View financial year summaries, monthly trends, customer distribution, and top buyers. Use the charts to identify patterns and make data-driven decisions.
Supported Data Formats and Tips
Features of Our Free Online Sales Analysis Dashboard
Everything you need to understand your sales performance. No downloads, no registration, just instant sales analytics.
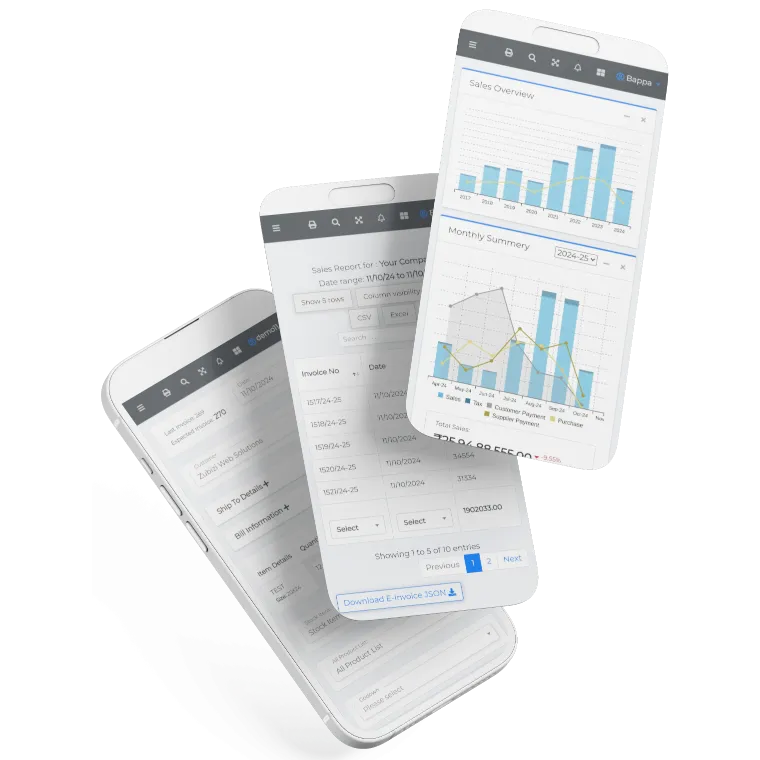
Financial Year Summary Charts
View your sales performance across multiple financial years with interactive bar charts. Compare year-over-year growth, see monthly averages, weekly trends, total unique customers, and invoice counts. The free sales analysis dashboard automatically detects Indian financial years (April to March).
RFM Customer Classification
Automatically segment customers into VIP, Regular, At-Risk, and New categories using weighted RFM (Recency, Frequency, Monetary) analysis.
Multi-Year Monthly Trends
Compare monthly sales across multiple years with stacked bar charts. Identify seasonal patterns and peak selling periods instantly.
Top Customer Rankings
See your top 15 customers by total purchases. View all-time rankings and current financial year leaders with invoice counts.
Key Metrics at a Glance
Instantly see total sales, invoice count, unique customers, and average order value. For comprehensive sales reporting.
100% Private and Secure
Your sales data never leaves your browser. All processing happens locally using JavaScript. No server uploads, no data collection, no tracking. Your invoice data, customer information, and sales figures remain completely confidential. Use this free sales analysis dashboard with total peace of mind.
We are constantly improving this sales analysis dashboard with new charts and insights.
Why Use Our Free Sales Analysis Dashboard?
Built by Zubizi, we understand what retail businesses need. Our sales analysis tool is designed with Indian financial year conventions and real business needs in mind.
Indian Financial Year Support
Automatically groups your sales data by Indian financial years (April to March). See year-over-year comparisons aligned with your tax filing periods. No manual adjustments needed for FY calculations.
Weighted RFM Analysis
Our customer classification uses a weighted RFM model that prioritizes what matters most: Monetary value (45%), Frequency (35%), and Recency (20%). Identify your VIP customers and at-risk buyers instantly.
Works with Any Data Source
Export data from Tally, Busy, MARG, QuickBooks, or any billing software. Just export to CSV or Excel. The tool auto-detects date formats and column types, making setup quick and effortless.
Instant Processing
No waiting for cloud processing. Your data is analyzed instantly in your browser. Even files with thousands of transactions load and process in seconds. Start making decisions faster.
No Data Storage
Your sales data is never stored on any server. Once you close the browser tab, your data is gone forever. This free sales analysis dashboard is perfect for businesses that prioritize data confidentiality.
100% Free Forever
No hidden costs, no premium tiers, no usage limits. Analyze your sales data as many times as you need. We built this tool to help businesses succeed, and we mean it when we say free.
Need Automatic Sales Reports for Your Business?
This free sales analysis dashboard is perfect for analyzing exported data from your billing software. But if you want automatic, real-time sales analytics without manual uploads, you need a complete solution. Zubizi ERP includes built-in sales reporting dashboards, customer analytics, GST compliance, and inventory management in one integrated system.
Get a personalized demo to see how Zubizi can streamline your retail operations. Our team will show you how easy it is to track sales trends, manage inventory, and generate GST-ready reports with a single system.
Frequently Asked Questions About Our Free Sales Analysis Dashboard
Common questions about analyzing sales data, file formats, and dashboard features.