What is Sales Analysis? A Complete Guide for Indian Business Owners
Learn what sales analysis is, why it matters for your business growth, and how to perform it step-by-step using modern tools. A complete guide for Indian SMEs.


If you’re running a business in India - whether it’s a garment manufacturing unit in Tirupur or a retail outlet in Mumbai - you know that staring at a “Total Sales” figure at the end of the month doesn’t tell the whole story.
I remember when my family first started in the garment business. We had months where revenue was high, but cash flow was tight. We had other months where sales seemed low, but profitability was surprisingly good. It was confusing. We were making decisions based on “gut feeling” and whatever chalan happened to be on the desk.
It wasn’t until we started digging deeper - moving beyond just “how much did we sell?” to “why did we sell it?” - that things really changed.
That’s what Sales Analysis is. And the good news? You don’t need a degree in data science to do it.
In this guide, I’ll walk you through exactly what sales analysis is, the key components you need to track, and a simple 5-step process to get started today.
What is Sales Analysis?
At its core, Sales Analysis is the process of examining your sales data to understand the performance of your business.
It’s not just about recording transactions. It involves looking at trends, metrics, and patterns to answer critical questions:
- Which products are actually driving profit?
- Which regions are underperforming?
- Why did sales dip during the festival season when they should have gone up?
Think of it as a health checkup for your business. Your “Total Revenue” is like your weight - it’s a useful number, but it doesn’t tell you if your heart is healthy or if you need to eat more protein. Sales analysis gives you that full diagnosis.
Key Components of Sales Analysis
To get a clear picture, you can’t just look at one number. You need to break it down. Here are the five main types of analysis that every business owner should know:
1. Sales Performance Analysis
This is the most common form. It measures how your sales are doing against your goals. Are your sales representatives meeting their targets? Is your store hitting its monthly quota?
- Example: Checking if your new Surat branch is meeting the ₹5 Lakh monthly target you set.
2. Sales Trend Analysis
This looks at patterns over time. It helps you identify seasonality (e.g., higher sales during Diwali) or long-term growth/decline.
- Why it matters: It stops you from panicking during a slow month if you know that month is historically slow every year.
3. Customer Analysis
Who is buying from you? Ideally, you want to know who your best customers are (so you can treat them like VIPs) and which ones might be drifting away (churn).
- Key stat: Customer Lifetime Value (CLV) - how much a single customer will spend with you over years, not just one transaction.
4. Product/Service Analysis
In my experience, typical businesses follow the 80/20 rule: 80% of your revenue comes from 20% of your products. This analysis tells you which SKUs are your winners and which ones are just gathering dust in the godown.
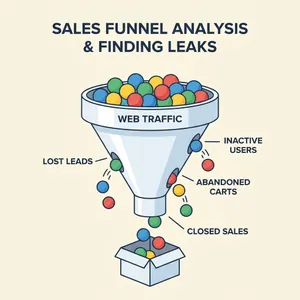
5. Pipeline Analysis
For B2B businesses, this is critical. It looks at the behavior of potential deals. How long does it take to close a deal? Where are leads dropping off?
- Goal: To fix “leaks” in your sales process so fewer leads are wasted.
Benefits: Why Should You Care?
You might be thinking, “Sariful, I’m already busy running the shop. Why add this extra work?”
Here is why accurate analysis is non-negotiable if you want to grow:
1. Data-Driven Decision Making
Stop guessing. Instead of ordering 500 units of a shirt because you “feel” it will sell, you order it because the data shows a 20% month-over-month increase in demand for that fabric.
2. Increased Revenue
Analysis often reveals money you didn’t know you were losing. You might find a territory that is completely untapped or a product bundle that customers love but you rarely promote.
3. Improved Forecasting
When you know your trends, you can predict cash flow better. This means you won’t overstock inventory (tying up cash) or run out of stock during peak season (losing sales).
4. Enhanced Efficiency
If you know that calling leads between 10 AM and 12 PM has a 2x higher success rate, your sales team stops wasting time calling at 4 PM. You get more results with the same amount of effort.
How to Perform a Sales Analysis (Step-by-Step)
Ready to start? Here is a simple 5-step workflow we use, which I recommend for any Indian SME.
Step 1: Define Your Goals
Don’t just “analyze” for the sake of it. Start with a question.
- “Why are sales in the North region down 10%?”
- “Which salesman has the highest conversion rate?”
- “Is our new festive discount actually profitable?”
Step 2: Collect the Data
Gather data from all your sources. This could be your billing software, your CRM, or even your manual ledgers (though I hope you’ve moved to digital!). You need accurate numbers on volume, revenue, costs, and dates.
Step 3: Analyze the Data
This is where you crunch the numbers to find answers. You might look for correlations (e.g., “Sales go up when we run Facebook ads”) or anomalies.
Pro Tip: Doing this manually in Excel can be a nightmare and prone to errors. You can use Zubizi’s free analysis tools to automatically aggregate and process this data.
Step 4: Create Visualizations
Numbers on a spreadsheet can be dizzying. To really “see” the trends, you need charts and graphs. A line chart showing a 6-month trend is instantly easier to understand than a column of numbers.
Recommended Tool: Zubizi’s free dashboard tools allow you to generate visual sales reports instantly. Whether you want to see a pie chart of top-selling products or a bar graph of monthly revenue, it’s all there at a glance.
Step 5: Take Action
Data is useless without action.
- If you found that Product A is your best seller, order more of it and put it in the front window.
- If you found that new customers aren’t returning, launch a loyalty program.
- If a specific salesperson is underperforming, arrange training for them.
The Future of Sales Analysis: Trends in 2026 and Beyond
As we move through 2026, sales analysis has evolved beyond simple spreadsheets. It is no longer just about looking backward at what happened. It is about predicting what will happen next.
Why This Is Important Now
The market is faster than ever. In 2026, customer preferences change in days, not months. If you rely on monthly reports, you are reacting to old news. The trend now is Real-Time Predictive Analytics.
Fact: Research indicates that companies using AI-driven sales analysis can reduce call times by 60% and increase deal closures by over 30%. This efficiency is what separates market leaders from the rest.
How Everyone Is Using It
Competitors in your space are likely already using these tools to:
- Predict Customer Needs: Algorithms analyze buying patterns to suggest products before the customer even asks.
- Automate Pricing: Dynamic pricing models adjust costs instantly based on demand, securing margins that manual calculations miss.
- Hyper-Personalization: Delivering the right message to the right person at the exact right time.
The Risk of Falling Behind
This is the harsh reality. If you are not using these advanced analytical techniques, you are operating blind. Your competitors who use data-driven insights will:
- Identify profitable niches before you do.
- Serve customers faster and more accurately.
- Optimize their costs while you struggle with waste.
In the coming years, the gap between data-driven businesses and traditional ones will become insurmountable. Adopting these techniques is not just a strategy for growth. It is a requirement for survival.
Conclusion
Sales analysis isn’t about creating complex reports that no one reads. It’s about finding the hidden opportunities in your business. It’s what separates a shop that just “gets by” from a business that scales year after year.
We learned this the hard way at Zubizi, but once we focused on the data, the path forward became clear.
If you want to start analyzing your sales without the headache of spreadsheets, give Zubizi a try today. It’s built for businesses just like yours.