Your Billing Software Is a Goldmine: Simple Data Analysis Tool for Apparel Retailers
Fashion business owners already have valuable data in their ERP and billing software. Discover how you can unlock its potential for better decision-making.


Most small and medium retail businesses already use billing software or ERP systems. Every sale, purchase bill, stock movement, customer detail, and return is already recorded and safely stored.
And then… nothing happens. 🦗
That data just sits there like an unused fabric roll in a warehouse, quietly losing value with time.
In current days, data is gold, and you are literally sitting on a goldmine without even realizing it.
When business owners hear the words “data” or “data analysis,” they usually imagine AI, machine learning, data science, big dashboards, advanced Excel, or consultants who charge more than a seasonal inventory budget.
And to be fair, they are not completely wrong.
Advanced data analysis is complex. It requires specialized skills, tools, and resources.
That’s why I chose to create a tool that simplifies data analysis for apparel retailers, making it accessible and actionable without the need for advanced technical skills.
In this blog post, I will share some simple yet effective ways on you you can leverage the data already present in your billing software to make better business decisions.
How to use our Tool
So, almost all billing/ERP software have this sales items report or sales details report or sales register report.
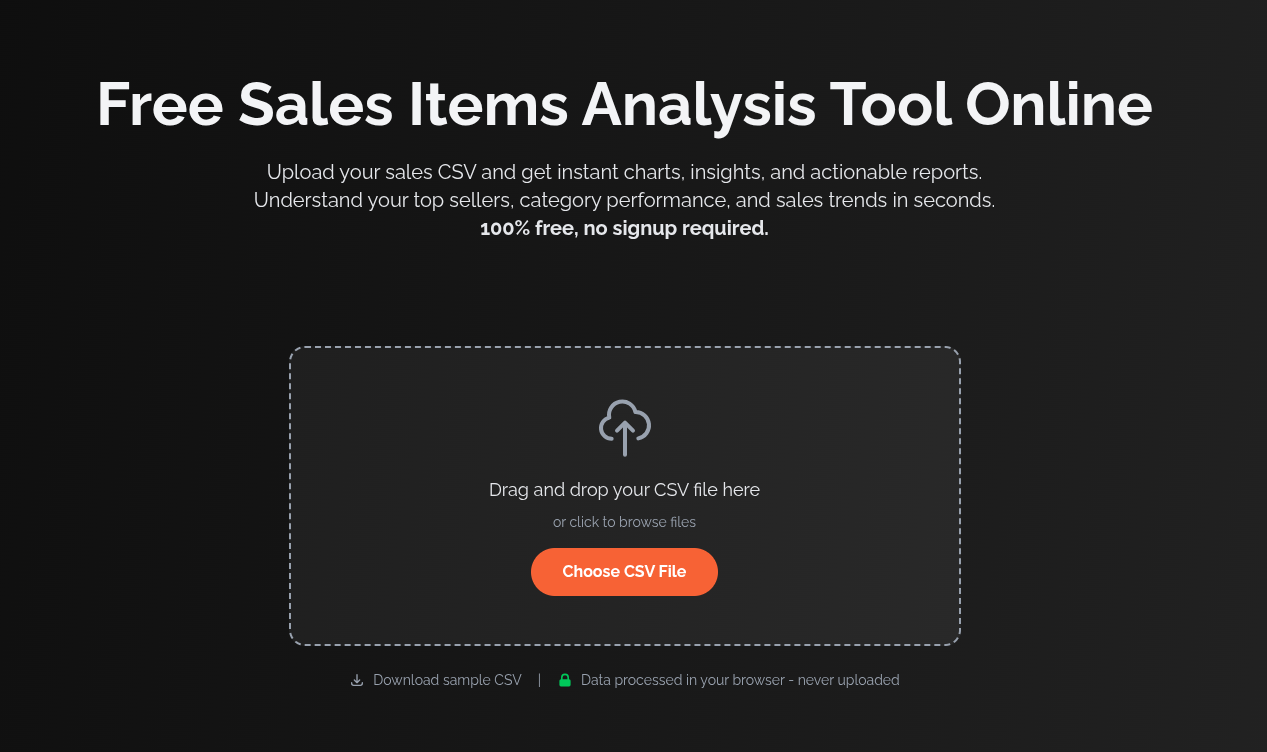
You can export this report as a CSV files.
Once you have the file, you can upload it to our sales items analysis tool designed specifically for apparel retailers.
Once you upload the CSV file, it will ask you to map the columns in your CSV to standard fields like Item Name, Item Code, Quantity Sold, Sale Date, Sale Amount, etc.
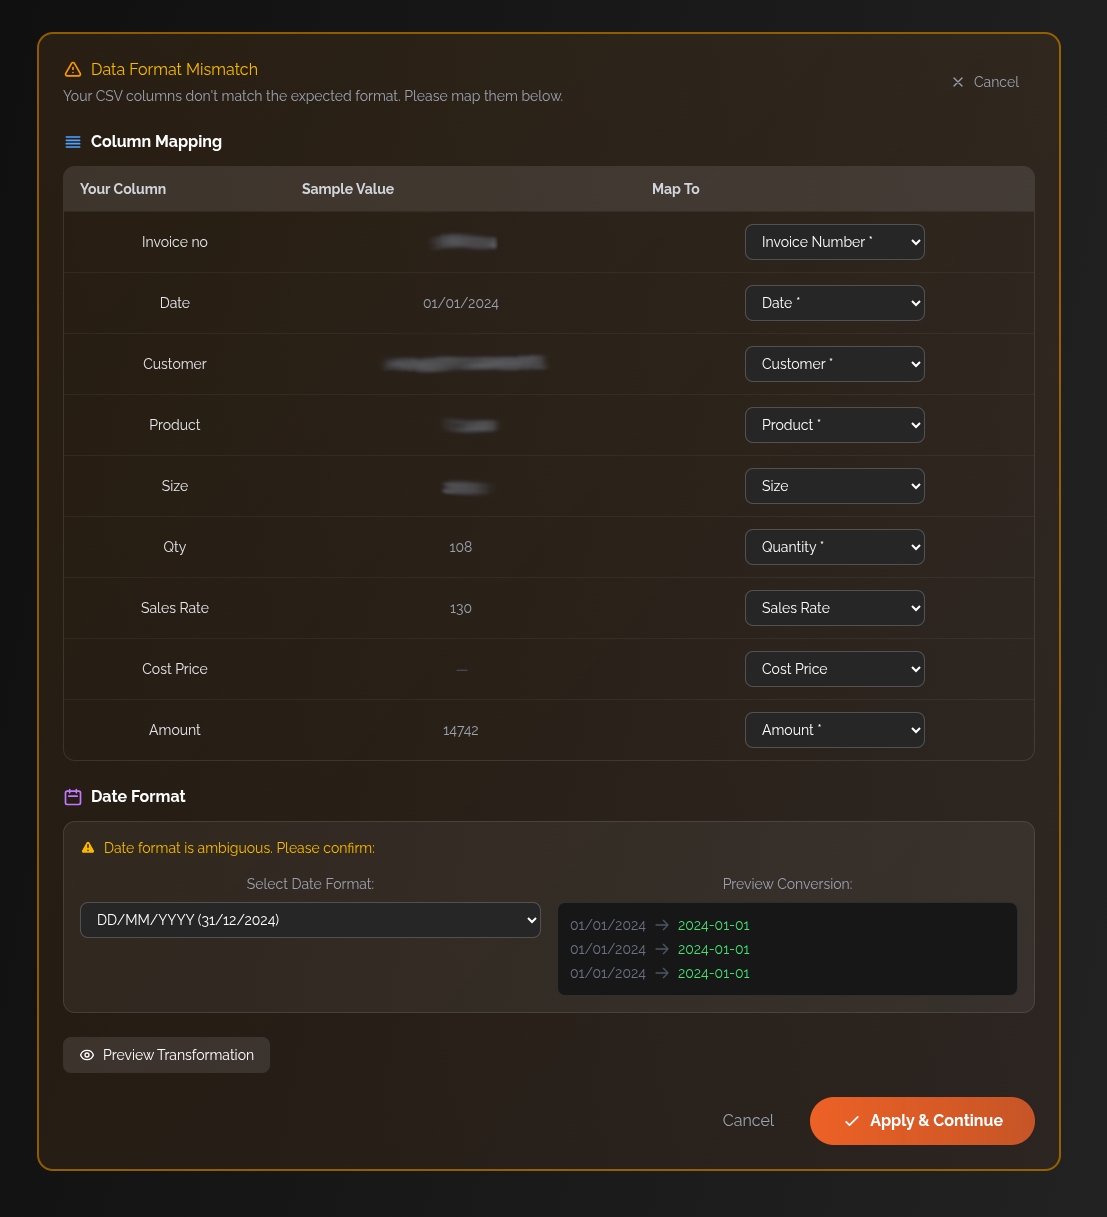
There, you can map the columns from your CSV file to the required fields in the tool, and also specify the date format used in your CSV. And click on “Apply and Continue”.
After that you will be shown the data you uploaded for confirmation.
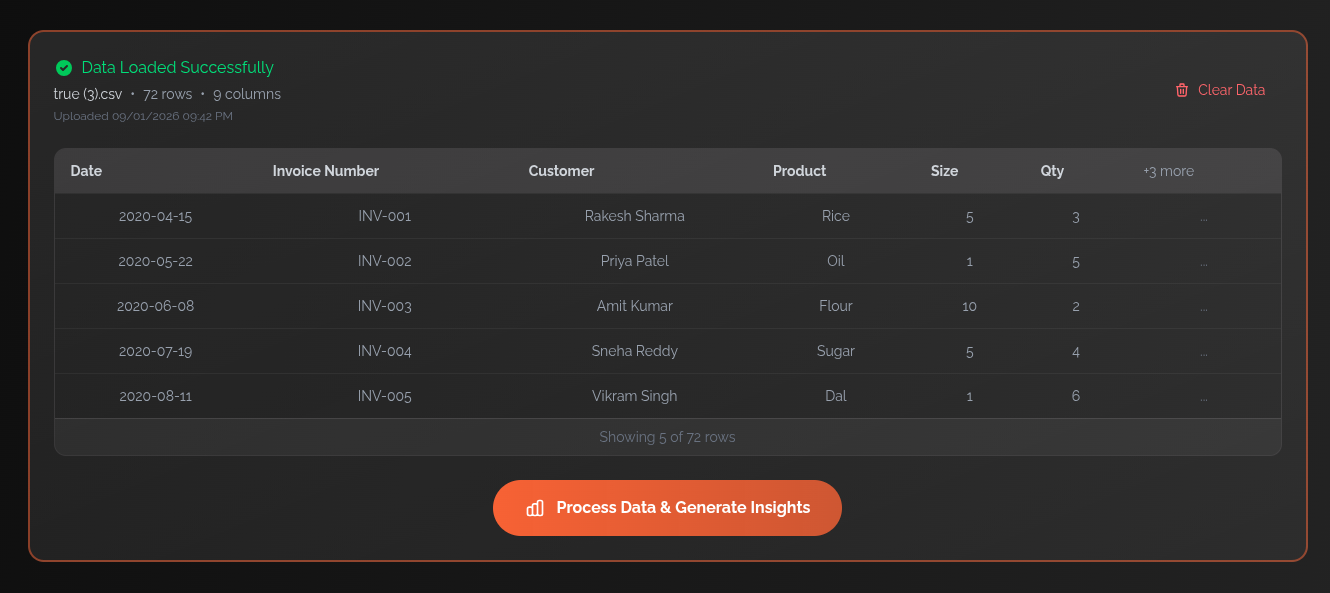
Now, just click on “Process Data & Generate Insights”.
The tool will process the data and provide you with some interesting insights.
In the next section, I will explain what this report shows and how you can use it to make better business decisions.
Understanding the Dashboard & Reports
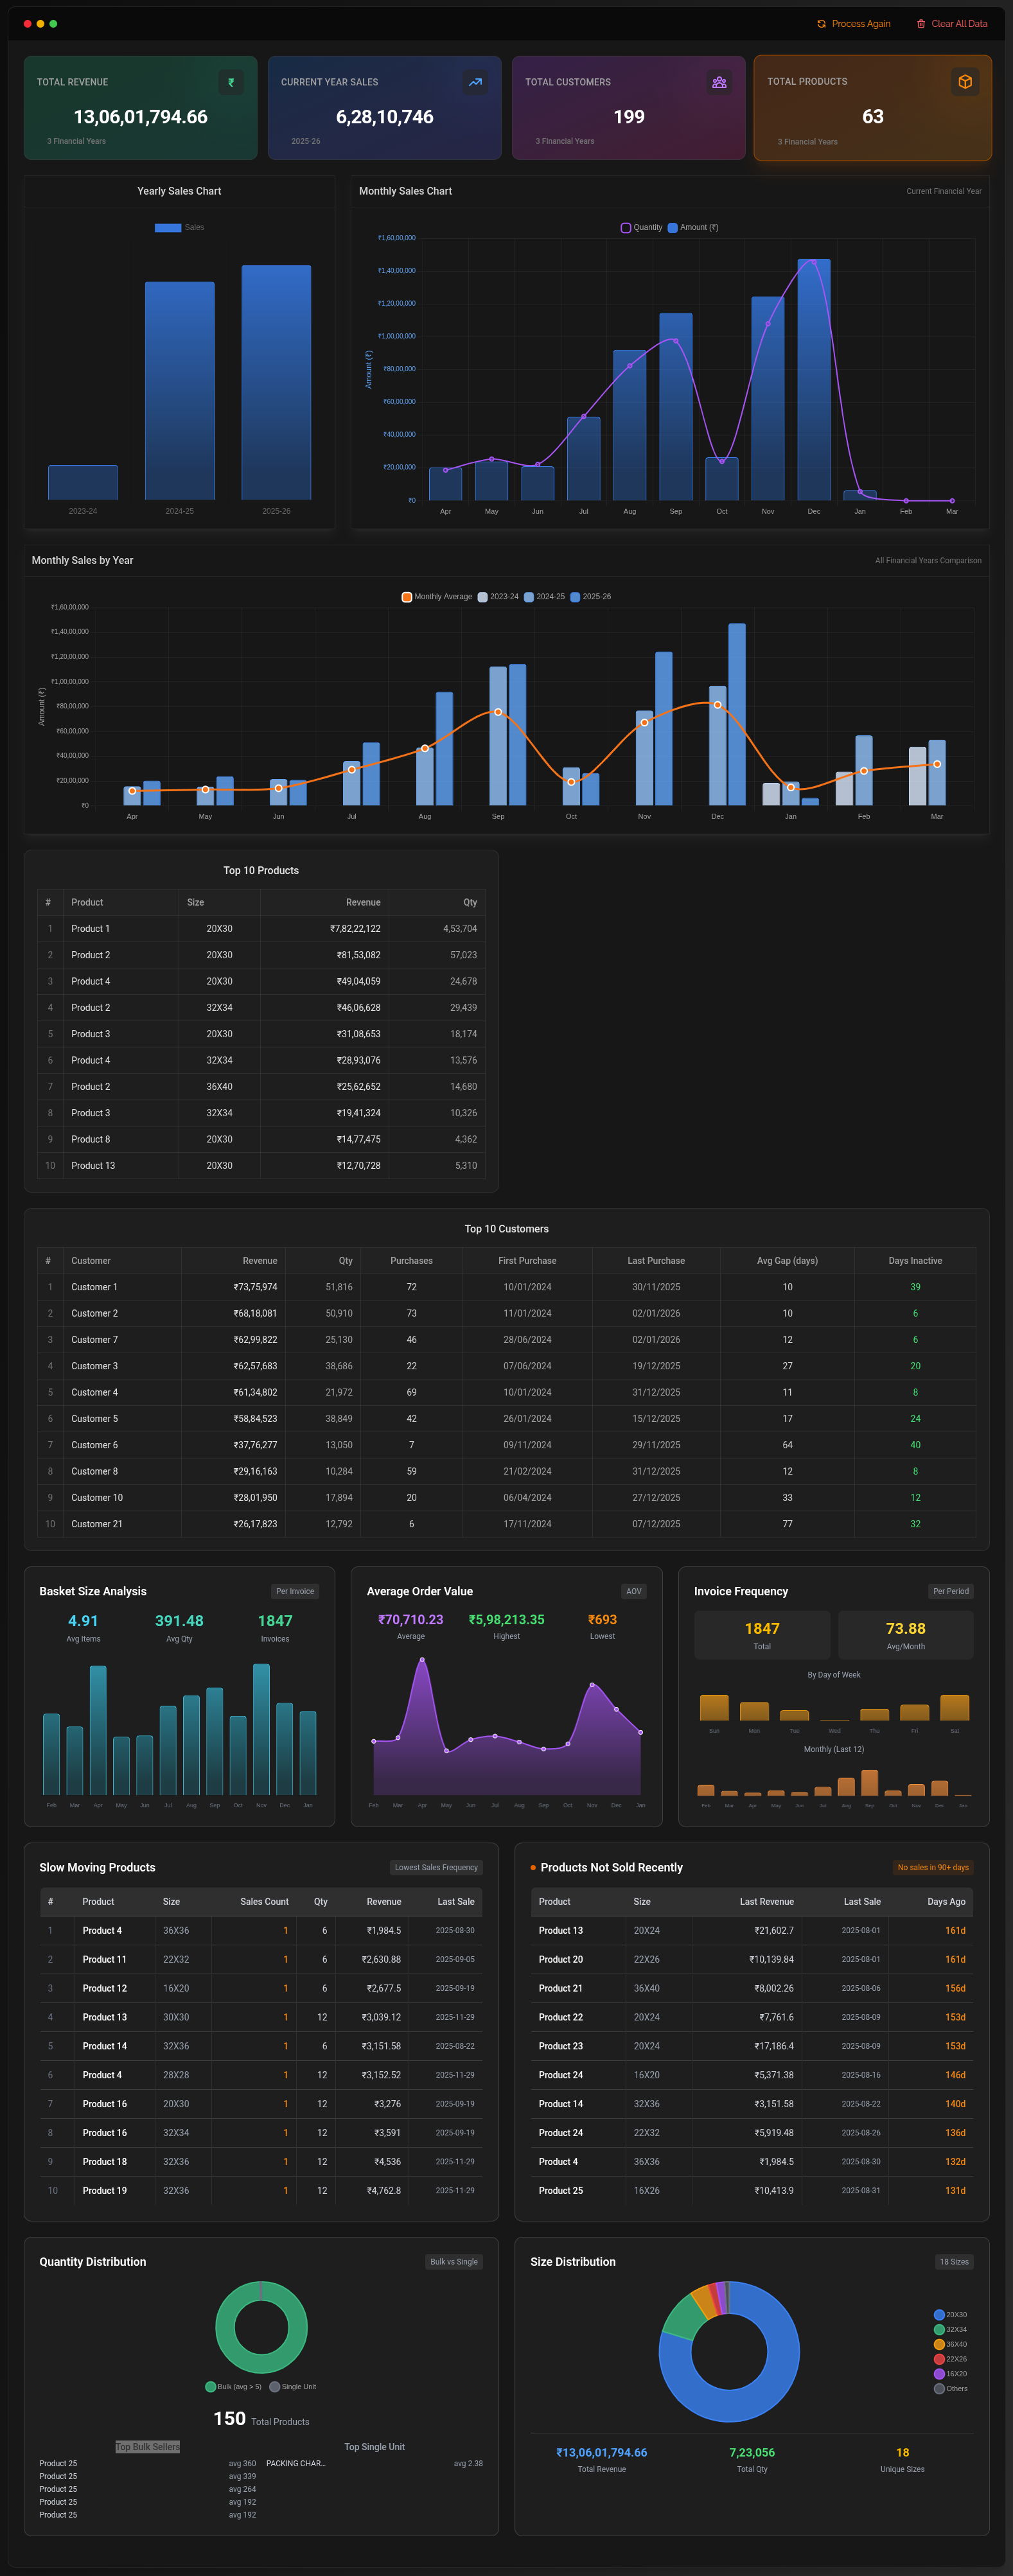
Now, even though this is report is generated with dummy data, I will go through it and explain how each report is insightful and what it tells about your business and what kind of decisions you can make based on it.
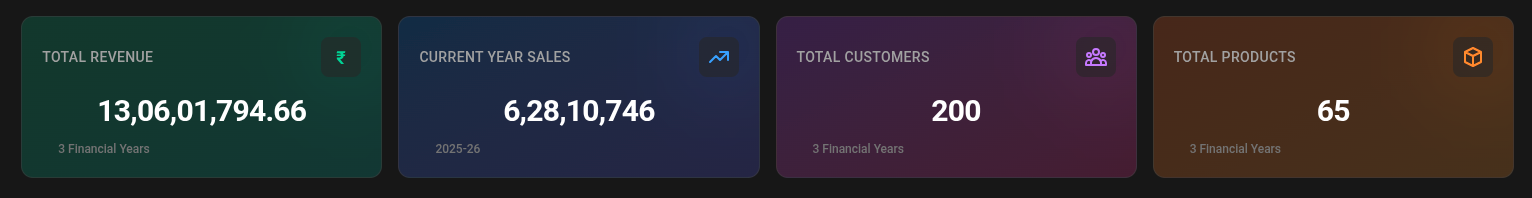
First the top cards, it’s pretty self explanatory. Total revenue, Current Year Sales, Total Customers, and Total Products.
You can notice for this report that, this business is generating around 13 Cr in total revenue with only 200 unique customers and 65 products. This indicates that the business has a high customer retention rate and is able to generate significant revenue from a relatively small customer base.
Yearly Sales Chart
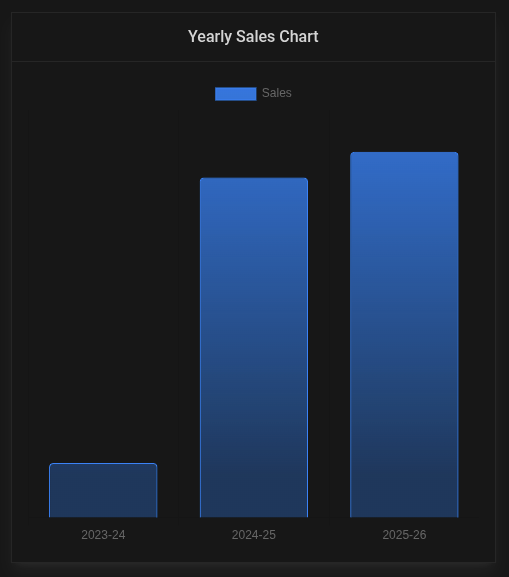
Shows sales volume across different years
Business Decisions:
- Identify year-over-year growth patterns
- Set realistic targets based on historical growth
- Spot if there’s stagnation or decline that needs addressing
Monthly Sales Chart
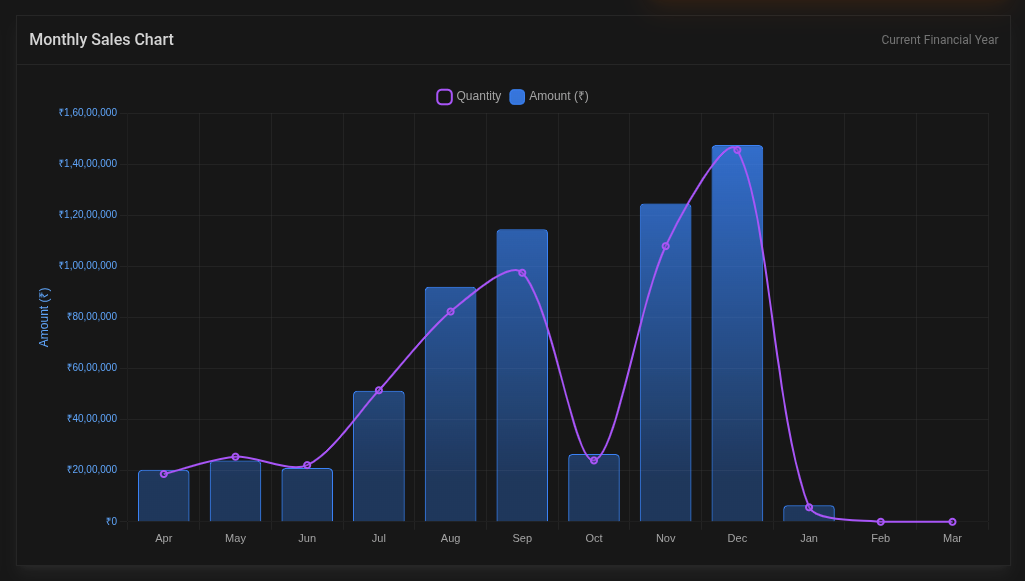
Displays both quantity sold (bars) and revenue (line) across months
Business Decisions:
- Identify peak seasons: Stock up inventory 1-2 months before peaks
- Plan promotions: Low months need marketing push or clearance sales
- Cash flow management: Anticipate high-revenue months for major expenses
- Staffing: Hire temporary staff during peak months
- If you notice significant variation - some months are very low, plan working capital accordingly
Monthly Sales by Year
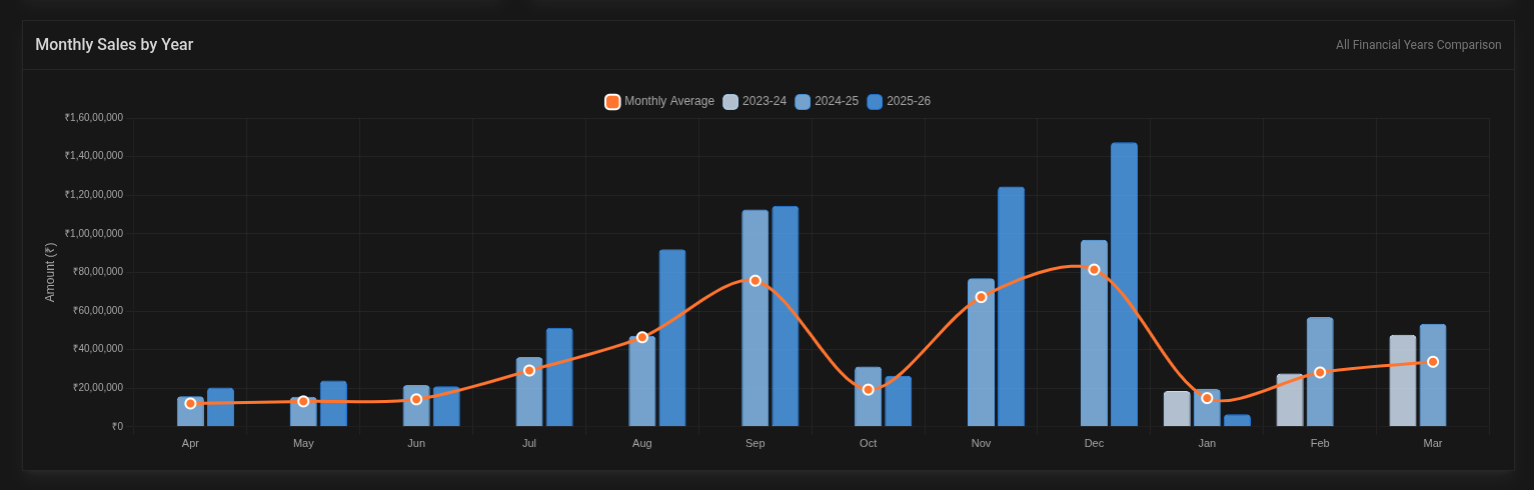
This one is important, because it shows monthly sales trends for each year separately.
This year-over-year comparison chart showing monthly sales performance across multiple financial years (2023-24, 2024-25, 2025-26) with a moving average trend line. It displays seasonal patterns and growth trends by comparing the same months across different years.
Business Decisions:
- Inventory Planning: Stock up 1-2 months before peak seasons
- Cash Flow Management: Save profits from peak months (Sep, Dec) to cover lean months (Oct, Jan-Feb)
- Staffing Strategy: Hire temporary staff before peak seasons, maintain lean team during low months
- Marketing Budget Allocation: Reduce ad spend during naturally high months, increase during low months to smooth demand, or you can do it vice versa, spend more during high months to maximize sales and provide discounts during low months to attract customers. Whichever strategy suits you best.
- Realistic Target Setting: Compare same months year-over-year (Oct 2024 vs Oct 2023), not month-to-month (Oct vs Sep)
- Working Capital Planning: Arrange credit/loans before peak seasons when pattern shows guaranteed high revenue
- New Product Launches: Time launches during rising trend months (July-Aug) for better adoption
Top 10 Products
Lists your bestselling products with Size, Revenue, and Quantity
Business Decisions:
- Never stock out: These drive your revenue - maintain safety stock
- Negotiate better prices: High volume = bargaining power with suppliers
- Cross-selling: Bundle these with slow movers
- Pricing power: Top sellers can potentially handle small price increases
- Expand variants: If Product 1 sells well, consider more sizes/colors
Top 10 Customers
Shows your highest-value customers with purchase frequency and recency
Business Decisions:
- VIP treatment: Offer loyalty discounts, priority service to retain them
- Risk management: Too much dependency on few customers is risky - diversify. Never put all your eggs in one basket!
- Credit terms: High-frequency buyers might get flexible payment terms
- Personalized marketing: Target them with new product launches first
- Calculate LTV: Average customer value helps determine acceptable acquisition costs
Basket Size Analysis
Shows distribution of order sizes
Business Decisions:
- Upselling: Average is ~5 items - train staff to suggest “one more item”
- Bundling: Create combo deals around the average basket size
- Free shipping threshold: Set it slightly above average to encourage larger orders
- Inventory location: Keep frequently bought-together items near each other
Average Order Value
Shows order value distribution
Business Decisions:
- Minimum order value: For B2B, set MOV slightly below average
- Volume discounts: Encourage orders above average with tiered pricing
- Payment terms: High AOV justifies investment in multiple payment options
- Sales targets: Set per-salesperson daily targets based on avg orders needed
Invoice Frequency
Shows billing patterns across months
Business Decisions:
- Staff scheduling: Peak invoice months need more billing staff/POS terminals
- System capacity: Ensure your billing software can handle peak loads
- Customer behavior: High frequency with low AOV might indicate wholesale buyers
Slow Moving Products
Lists products with low sales velocity
Business Decisions:
- Clearance sales: Heavy discounts to free up cash (30-50% off)
- Stop reordering: Don’t replenish until existing stock clears
- Bundle with bestsellers: “Buy Product 1, get Product 5 at 50% off”
- Return to supplier: If possible, negotiate returns for recent purchases
- Discontinue: If consistently slow across seasons, remove from catalog
- Storage costs: Calculate if it’s cheaper to discount heavily than store longer
Products Not Sold Recently
Items with no recent sales but still in inventory (showing “Last Sale” dates and “Days Ago”)
Business Decisions:
- Immediate action needed: Products with 150+ days no sale are dead weight. They’re not “vintage,” they’re just old.
- Aggressive clearance: Sell at cost or below to recover cash
- Write-offs: For very old stock, consider tax write-offs
- Supplier review: Stop working with suppliers of consistently dead products
- Space optimization: Clear warehouse space for fast-moving inventory
Quantity Distribution (Donut Chart)
Shows which products account for most units sold
Business Decisions:
- 80/20 rule: Likely 20% products drive 80% volume - focus on those
- Warehouse layout: Place high-volume items in easily accessible locations
- Reorder automation: Set automatic reorder points for high-volume SKUs
Size Distribution (Donut Chart)
Shows size-wise sales breakdown
Business Decisions:
- Ordering ratios: If “Medium” is 40% of sales, order accordingly
- Size availability: Never stock out popular sizes - frustrates customers
- Clearance strategy: Deep discounts on unpopular sizes
- Marketing: Highlight availability of popular sizes in ads
- Production planning: For manufacturers, optimize production runs by size demand
Putting These Insights Into Action
Having data is one thing. Acting on it is where the real value lies.
Here’s a simple framework to start using these insights:
Weekly Review (15 minutes)
- Check top 10 products - are any running low?
- Review recent customer activity - anyone missing who used to buy regularly?
- Glance at slow movers - any that need immediate attention?
Monthly Review (1 hour)
- Compare this month vs same month last year
- Identify products to reorder and products to clear
- Plan next month’s promotions based on historical patterns
- Review customer purchase frequency - who needs a follow-up call?
Quarterly Review (Half day)
- Deep dive into seasonal trends
- Evaluate supplier performance based on product velocity
- Assess customer concentration risk
- Set targets for next quarter based on data, not gut feeling
Before Major Decisions
Launching a new product line? Check what categories sell best.
Expanding to a new location? Analyze customer geography data.
Hiring more staff? Look at invoice frequency to justify the need.
Negotiating with suppliers? Pull up your purchase volumes for leverage.
Common Mistakes to Avoid
While data analysis is powerful, there are some pitfalls to watch out for:
1. Analysis Paralysis
Do not spend hours studying dashboards without taking action. Staring at graphs won’t magically increase sales. Set aside specific time for analysis and specific time for implementation.
2. Ignoring Context
Low sales in April does not automatically mean something is wrong. Check if it is a pattern (wedding season slowdown?) or an anomaly (lockdown year?).
3. Chasing Every Insight
Not every data point needs action. Focus on high impact areas - top customers, fast movers, and obvious dead stock.
4. One-Time Exercise
Data analysis is not a one-time activity. Make it a habit. Weekly, monthly, quarterly - build it into your routine.
5. Forgetting the Human Element
Data tells you WHAT happened. Your team tells you WHY. Combine both for better decisions.
Getting Started Today
You do not need to wait for a perfect setup. Start with what you have:
Step 1: Export Your Data
Open your billing software. Find the sales report or sales register. Export it as CSV.
Step 2: Upload to Our Tool
Visit our free sales items analysis tool. Upload your CSV file.
Step 3: Map Your Columns
Match your CSV columns to the required fields. Select your date format. Click Continue.
Step 4: Review Your Insights
Spend 30 minutes going through each report. Note down 3 actionable items.
Step 5: Take Action
Pick the easiest action item and do it TODAY. Maybe it is calling a lapsed customer. Maybe it is marking slow stock for clearance. Just do one thing.
Your Data Is Already Working Against Time
Here is the thing about retail data - it gets less valuable with every passing day.
That hot selling product from last season? If you do not track it, you might miss reordering it this season.
That customer who used to buy every month but stopped 6 months ago? By now, they have probably found another supplier.
That dead stock sitting in your warehouse? Every day it occupies space and ties up capital that could be working elsewhere.
The good news is that you already have the data. You just need to start looking at it.
Conclusion
Your billing software is not just a tool for generating invoices. It is a business intelligence system hiding in plain sight.
Every transaction you record is a piece of the puzzle. Every return, every customer, every product sold - it all tells a story about your business.
The fashion retail businesses that thrive are not the ones with the most inventory or the biggest showrooms. They are the ones that understand their numbers. They know which products to push, which customers to nurture, and which trends to follow.
You do not need expensive consultants or complex software to start. You just need to look at the data you already have.
Start today. Export that sales report. Upload it to our tool. Spend 30 minutes understanding what your data is telling you.
Your next big business decision should be backed by data, not just instinct. 📊