ABC Analysis in Inventory Management: The Complete Guide for Indian Businesses
ABC Analysis is an inventory classification technique that helps prioritize stock based on value. Learn how to implement it with formulas, examples, and best practices for Indian SMEs.

Managing inventory can feel overwhelming. You have hundreds (or thousands) of products. Each one needs tracking. Each one needs ordering. But here’s the truth: not all products deserve equal attention.
Some products make you most of your money. Others just take up shelf space. The trick is knowing which is which. That’s exactly what ABC analysis in inventory management helps you figure out.
In this guide, I’ll walk you through everything you need to know about ABC analysis - what it is, why it matters, how to calculate it, and how you can use it in your business starting today.
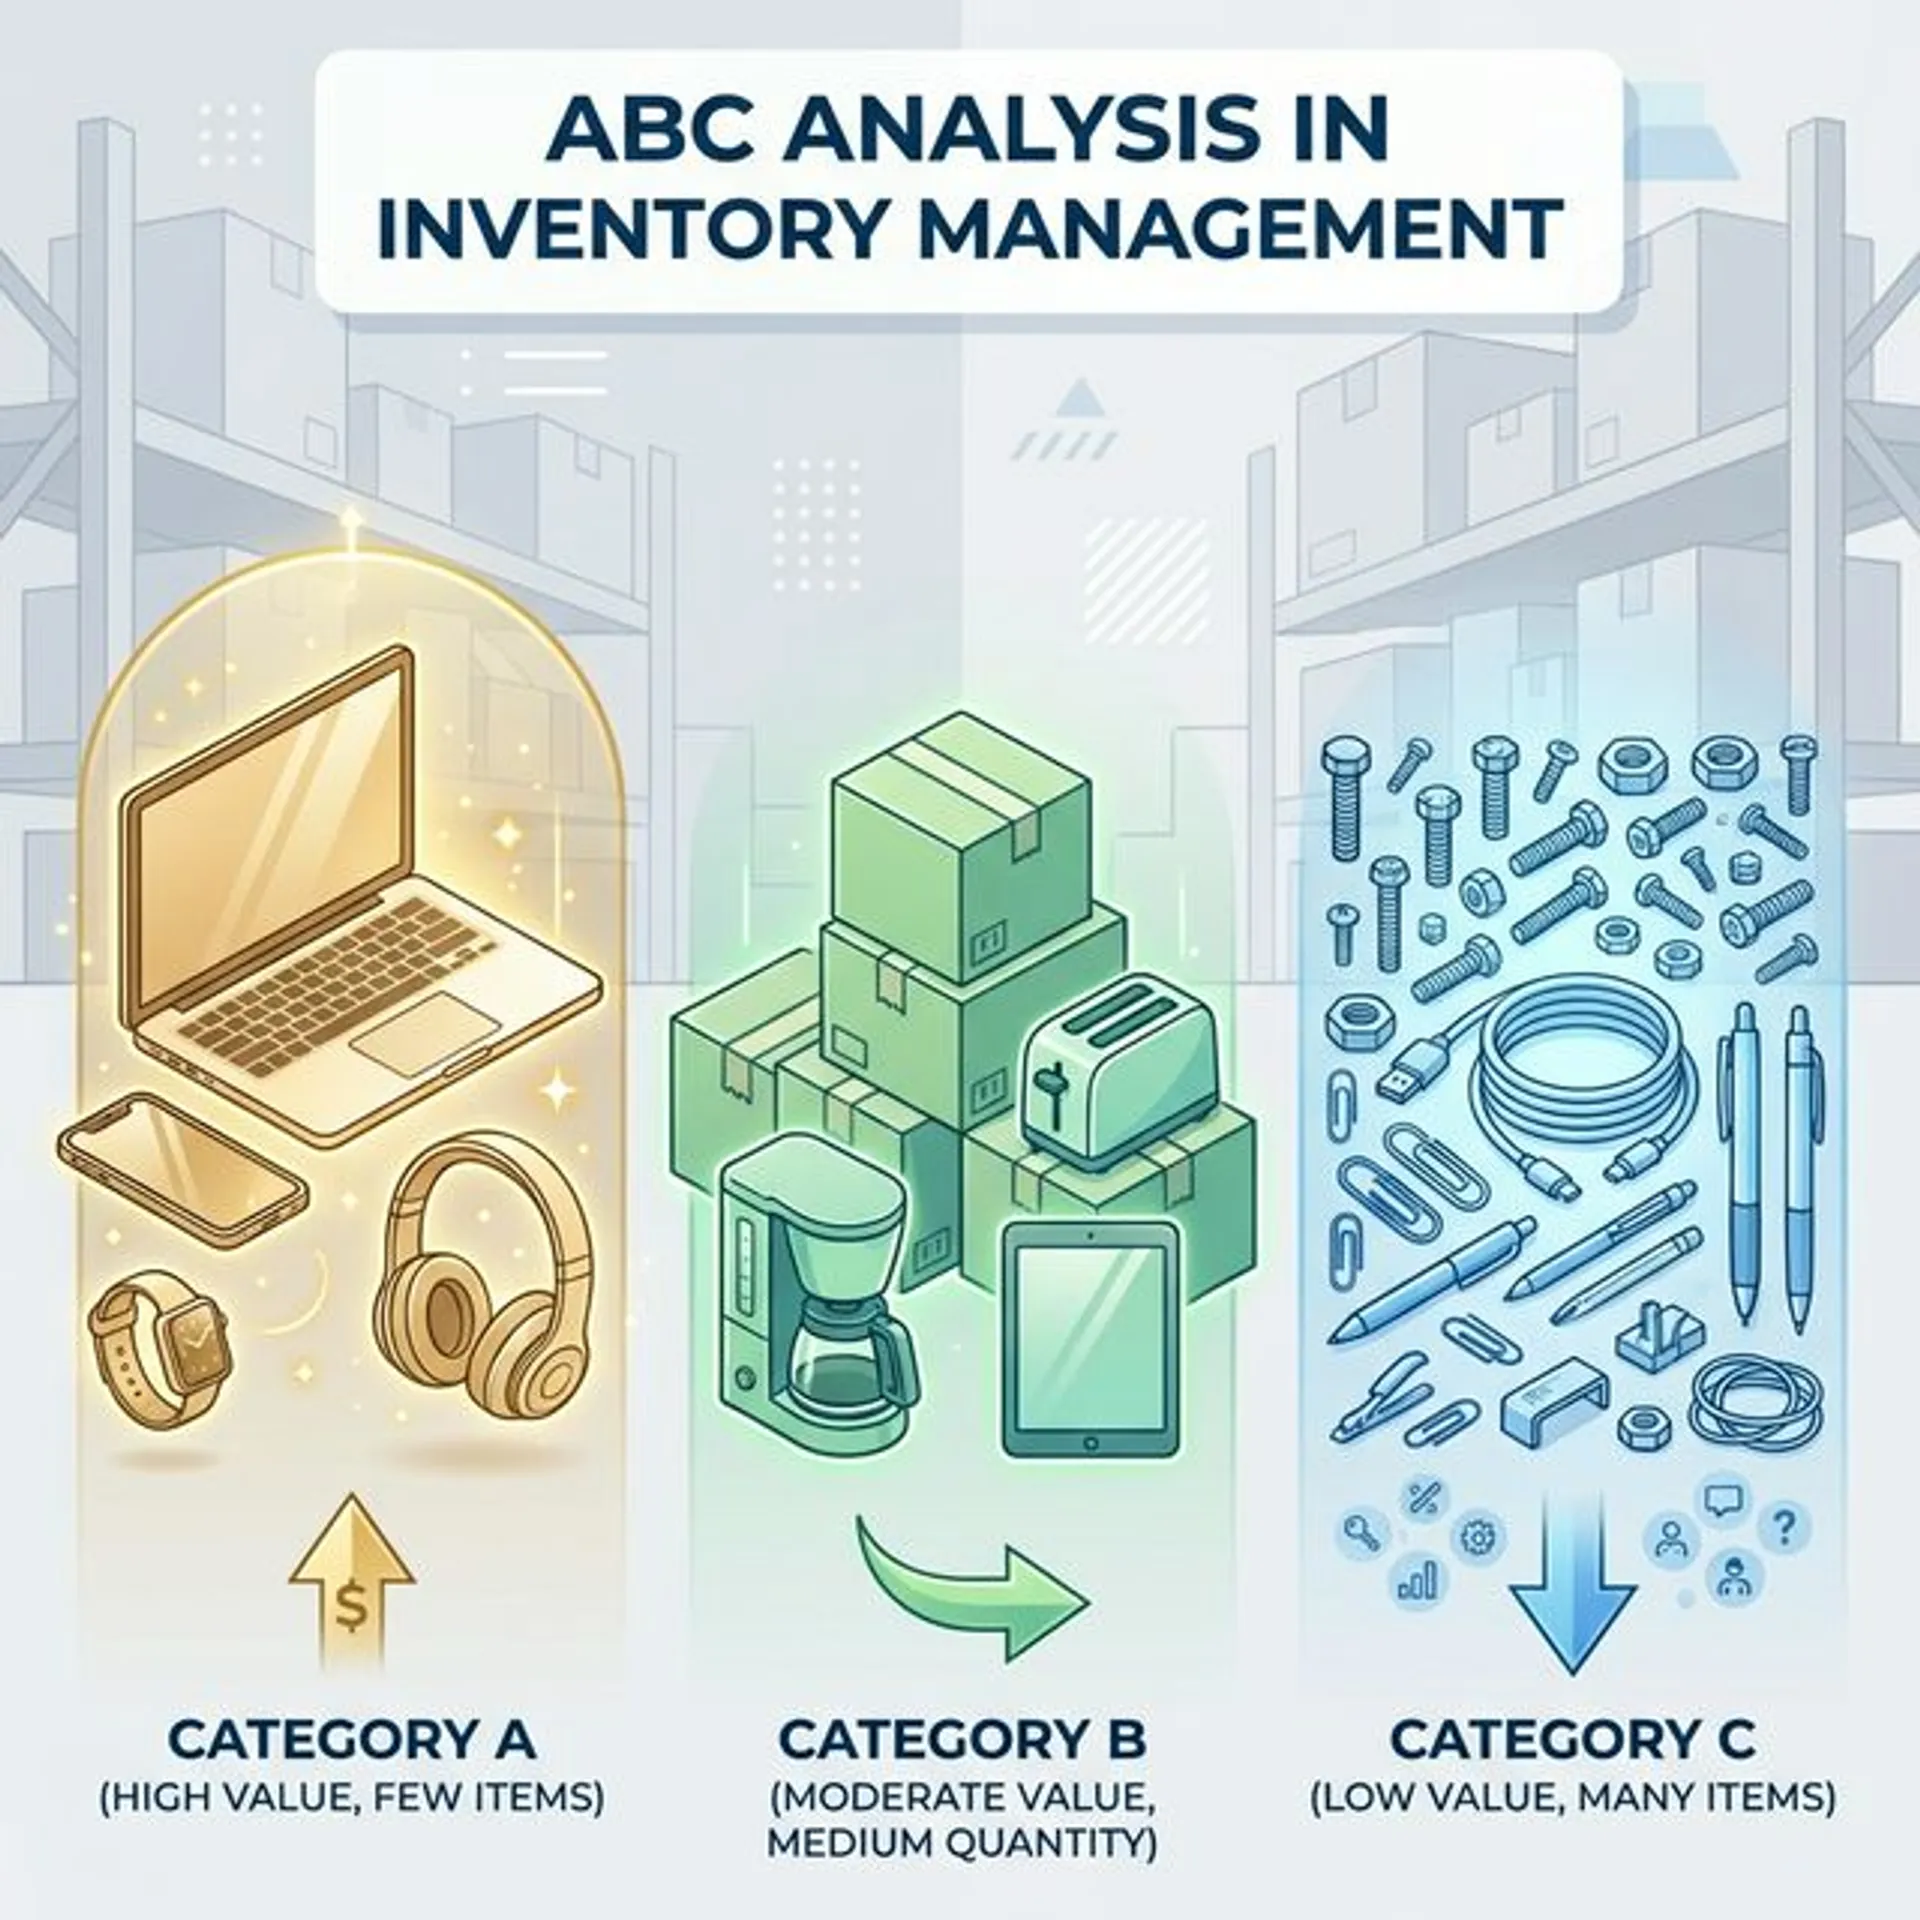
What is ABC Analysis in Inventory Management?
ABC analysis in inventory management is a technique that divides your inventory into three categories based on their value and importance to your business:
- A items: High-value products (the vital few)
- B items: Moderate-value products (the important middle)
- C items: Low-value products (the trivial many)
This method is based on the Pareto Principle (also called the 80/20 rule). In inventory terms, this means roughly 80% of your inventory value comes from just 20% of your items.
Think of it like this: in a mobile phone shop, the latest flagship smartphones (iPhones, Samsung Galaxy S series) might be only 15% of your product count but could represent 75% of your total sales value. These are your A items. Phone cases and screen protectors? They’re probably C items - lots of SKUs, but they don’t move the needle much on revenue.
Why is ABC Analysis Important?
Running a business means making decisions every day. Where should you spend your time? Which products need closer attention? ABC analysis in inventory management answers these questions.
Focus Your Efforts Where They Matter
You can’t give equal attention to every product. With ABC analysis, you know exactly which items need daily monitoring and which ones can run on autopilot.
Reduce Carrying Costs
Inventory costs money - storage space, insurance, the risk of damage or obsolescence. When you classify items properly, you can reduce safety stock for C items and free up capital.
Prevent Stockouts on Critical Items
Running out of an A item is a disaster. Running out of a C item? Annoying, but manageable. ABC analysis helps you set appropriate reorder points for each category.
Improve Cash Flow
Your A items tie up most of your capital. By managing them carefully, you can optimize working capital and reduce how much cash sits idle in your warehouse.
Make Smarter Purchasing Decisions
When you know your A items, you can negotiate better deals with suppliers, plan purchases more strategically, and forecast demand more accurately.
The Three Categories Explained
Let’s break down each category in ABC analysis in inventory management:
Category A: The Vital Few
| Metric | Typical Range |
|---|---|
| % of Total Items | 10-20% |
| % of Total Value | 70-80% |
| Control Level | Tight |
| Monitoring | Daily/Weekly |
What they are: Your most valuable products. High demand, high price, or both. These are the items that generate most of your revenue.
How to manage them:
- Monitor stock levels frequently (daily or weekly)
- Maintain accurate demand forecasts
- Keep moderate safety stock - stockouts are expensive
- Negotiate best terms with suppliers
- Store in easily accessible locations
Example: For a clothing boutique, A items might be bestselling ethnic wear collections during festival season. For an electronics retailer, it’s flagship smartphones and laptops.
Category B: The Important Middle
| Metric | Typical Range |
|---|---|
| % of Total Items | 30% |
| % of Total Value | 15-25% |
| Control Level | Moderate |
| Monitoring | Weekly/Monthly |
What they are: Products with moderate value and steady demand. Not as critical as A items, but still important to your business.
How to manage them:
- Review stock levels weekly or bi-weekly
- Use standard reorder points
- Maintain reasonable safety stock
- Watch for items moving up to A or down to C
Example: Mid-range apparels, accessories that complement A-item sales, or moderately priced electronics.
Category C: The Trivial Many
| Metric | Typical Range |
|---|---|
| % of Total Items | 50% |
| % of Total Value | 5-10% |
| Control Level | Loose |
| Monitoring | Monthly/Quarterly |
What they are: Low-value items that make up the bulk of your product count. Individually, they don’t impact revenue much.
How to manage them:
- Simple, automated reorder systems
- Order in bulk to reduce ordering costs
- Minimal monitoring - set it and forget it
- Accept slightly higher stockout risk
- Store in less prime locations
Example: Buttons and needles for a garment shop, cables and adapters for electronics stores, or basic stationery supplies.
How to Calculate ABC Analysis: Step-by-Step
Here’s a practical walkthrough of implementing ABC analysis in inventory management for your business:
Step 1: Gather Your Data
For each product, you need:
- Annual sales quantity (units sold per year)
- Unit cost or selling price
Most inventory management software can generate this data easily. If you’re using spreadsheets, export your sales history.
Step 2: Calculate Annual Consumption Value
For each item, multiply the annual quantity by the unit cost:
Annual Consumption Value = Annual Quantity x Unit Cost
Step 3: Rank Items by Value
Sort all items from highest to lowest annual consumption value. Your most valuable item goes at the top.
Step 4: Calculate Cumulative Percentages
For each item, calculate:
- What percentage of total value it represents
- Running cumulative total of that percentage
Step 5: Assign Categories
Using typical thresholds:
- A items: Top items contributing to 70-80% of cumulative value
- B items: Next items contributing to 15-25% of value
- C items: Remaining items (usually 5-10% of value)
Practical Example
Let’s say you run a small electronics shop with 10 products. Here’s how ABC analysis would work:
| Product | Unit Price (Rs.) | Annual Units | Annual Value (Rs.) | Rank |
|---|---|---|---|---|
| Smartphone X | 25,000 | 100 | 25,00,000 | 1 |
| Laptop Y | 45,000 | 50 | 22,50,000 | 2 |
| Tablet Z | 15,000 | 80 | 12,00,000 | 3 |
| Smartwatch | 8,000 | 60 | 4,80,000 | 4 |
| Earbuds | 2,500 | 150 | 3,75,000 | 5 |
| Power Bank | 1,200 | 200 | 2,40,000 | 6 |
| Phone Case | 500 | 400 | 2,00,000 | 7 |
| Screen Protector | 300 | 500 | 1,50,000 | 8 |
| USB Cable | 150 | 600 | 90,000 | 9 |
| Charger | 400 | 150 | 60,000 | 10 |
Total Annual Value: Rs. 75,45,000
Now let’s calculate cumulative percentages:
| Product | Annual Value | % of Total | Cumulative % | Category |
|---|---|---|---|---|
| Smartphone X | 25,00,000 | 33.1% | 33.1% | A |
| Laptop Y | 22,50,000 | 29.8% | 62.9% | A |
| Tablet Z | 12,00,000 | 15.9% | 78.8% | A |
| Smartwatch | 4,80,000 | 6.4% | 85.2% | B |
| Earbuds | 3,75,000 | 5.0% | 90.2% | B |
| Power Bank | 2,40,000 | 3.2% | 93.4% | B |
| Phone Case | 2,00,000 | 2.7% | 96.1% | C |
| Screen Protector | 1,50,000 | 2.0% | 98.1% | C |
| USB Cable | 90,000 | 1.2% | 99.3% | C |
| Charger | 60,000 | 0.8% | 100% | C |
Result:
- A items (3 products, 30%): Smartphone, Laptop, Tablet - contribute 78.8% of value
- B items (3 products, 30%): Smartwatch, Earbuds, Power Bank - contribute 14.6% of value
- C items (4 products, 40%): Cases, Screen Protectors, Cables, Chargers - contribute 6.6% of value
When Should You Use ABC Analysis?
ABC analysis in inventory management is useful in several scenarios:
Setting Reorder Points
A items need carefully calculated reorder points with adequate safety stock. C items can use simpler rules - when stock drops below X, order Y.
Warehouse Organization
Place A items in prime locations for easy access. C items can go in harder-to-reach areas since they move less frequently.
Cycle Counting
Instead of counting all inventory annually, count A items monthly, B items quarterly, and C items yearly.
Supplier Negotiations
Focus negotiation efforts on A items where small percentage savings translate to significant rupee amounts.
Demand Forecasting
Invest in accurate forecasting for A items. C items can use simpler historical averages.
Advantages of ABC Analysis
When implemented correctly, ABC analysis in inventory management delivers real benefits:
- Better resource allocation: Focus time and effort where returns are highest
- Reduced inventory costs: Lower holding costs by optimizing stock levels per category
- Improved cash flow: Less capital locked in slow-moving, low-value items
- Fewer stockouts on crucial items: Tighter control on A items prevents lost sales
- Efficient warehouse operations: Smart product placement saves time
- Data-driven decisions: Move beyond gut feeling to actual numbers
Disadvantages and Limitations
No technique is perfect. Here are some challenges with ABC analysis:
It’s Static
Product classifications change over time. A bestseller today might be obsolete next year. You need to recalculate ABC analysis regularly - at least quarterly for fast-moving businesses.
Focuses Only on Value
ABC analysis looks at monetary value. But some C items might be critical for operations. A Rs. 50 bolt might stop a Rs. 50 lakh machine if it’s missing.
Ignores Seasonality
A product might be a C item for 10 months but an A item during Diwali season. Standard ABC analysis won’t catch this.
Requires Good Data
Garbage in, garbage out. If your sales data is inaccurate, your ABC classifications will be wrong.
Can Lead to C-Item Neglect
Just because C items are low value doesn’t mean they don’t matter. Customers still expect them to be in stock.
How to Overcome ABC Analysis Limitations
Here’s how to make ABC analysis in inventory management work better:
Review Regularly
Update your classifications quarterly or when you notice significant demand changes. Modern inventory management systems can automate this.
Use Multi-Criteria Classification
Don’t just look at value. Consider:
- Criticality (is the item essential for operations?)
- Lead time (how long to replenish?)
- Demand variability (how predictable is demand?)
Apply Seasonal Adjustments
Create separate ABC classifications for different seasons. Festival season and regular season might have very different A items.
Maintain Minimum Service Levels
Even for C items, set a minimum acceptable service level. No customer likes hearing “out of stock.”
Is ABC Analysis Only Based on Monetary Value?
Traditionally, yes. But smart businesses adapt ABC analysis in inventory management to their specific needs.
You can classify based on:
- Revenue contribution: Most common approach
- Profit margins: High-margin items might deserve A-level attention even with lower volume
- Strategic importance: Items critical for key customers
- Supply risk: Items with long lead times or single-source suppliers
- Demand volatility: Unpredictable items might need closer monitoring
Many businesses use a hybrid approach - combining multiple factors into a single classification system.
Implementing ABC Analysis with Software
Manual ABC analysis works for small inventories. But as you grow, software becomes essential.
Modern inventory management tools can:
- Automatically calculate ABC classifications
- Update categories based on latest sales data
- Generate alerts when items shift categories
- Set different reorder rules per category
- Provide visual dashboards of your inventory distribution
At Zubizi, our inventory management software includes built-in ABC analysis that updates automatically as your business evolves. This means you always have current classifications without manual recalculation.
Can ABC Analysis Work for Indian SMEs?
Absolutely. In fact, ABC analysis in inventory management is especially valuable for Indian small and medium businesses where capital is often tight.
Here’s how different Indian businesses can apply it:
Fashion Retailers
- A items: Bestselling ethnic wear, trending designs
- B items: Seasonal basics, accessories
- C items: Older stock, rarely-requested sizes
Kirana Stores
- A items: Staples (atta, rice, cooking oil)
- B items: Personal care, branded snacks
- C items: Specialty items, slow-moving brands
Electronics Shops
- A items: Smartphones, laptops, TVs
- B items: Tablets, smartwatches, mid-range phones
- C items: Accessories, cables, cases
Manufacturing Units
- A items: Critical raw materials, high-cost components
- B items: Regular consumables
- C items: Maintenance supplies, low-cost parts
Frequently Asked Questions
What is ABC analysis in inventory management in simple words?
ABC analysis is a way of sorting your products into three groups based on their importance. A items are your most valuable products that need close attention. B items are moderately important. C items are low-value products that need minimal monitoring. This helps you focus your time and money where it matters most.
How often should I recalculate ABC classifications?
For most businesses, quarterly review works well. If you’re in a fast-moving industry like fashion or electronics, monthly reviews might be better. The key is to update before classifications become severely outdated.
Can a product move between categories?
Yes, and they often do. A new product launch might start as a C item and become an A item as it gains popularity. Older products often slide from A to C as they become obsolete. Regular review catches these shifts.
What’s the difference between ABC analysis and XYZ analysis?
ABC analysis classifies by value. XYZ analysis classifies by demand variability: X items have stable demand, Y items have variable demand, and Z items have irregular demand. Many businesses combine both (ABC-XYZ analysis) for more nuanced inventory control.
Is ABC analysis the same as the 80/20 rule?
ABC analysis is based on the 80/20 rule (Pareto Principle), but it’s more structured. The 80/20 rule says roughly 80% of effects come from 20% of causes. ABC analysis applies this principle specifically to inventory by creating three distinct categories with different management approaches.
Related Inventory Management Techniques
ABC analysis works well alongside other inventory management methods:
- Just-in-Time (JIT): Particularly effective for A items where holding costs are high
- Economic Order Quantity (EOQ): Use precise EOQ calculations for A items
- Safety Stock: Higher safety stock for A items, minimal for C items
- FIFO: Important for all categories with expiry dates or obsolescence risk
Conclusion
ABC analysis in inventory management isn’t complicated, but it’s powerful. By simply categorizing your products into A, B, and C groups, you can make smarter decisions about where to focus your attention, how much stock to keep, and when to reorder.
The key takeaways:
- A items (10-20% of products, 70-80% of value) need tight control
- B items (30% of products, 15-25% of value) need moderate attention
- C items (50% of products, 5-10% of value) can run on simpler systems
Start with the calculation I showed you. Rank your products by annual value, identify the thresholds, and assign categories. Then adjust your management approach for each category.
The best time to implement ABC analysis? Today. Your inventory costs will thank you.
Need help managing your inventory? Contact us to see how Zubizi’s inventory management software can automate ABC analysis and help you run a more efficient business.